

The K-Shaped Economy Is Hiding Inside Your Numbers
Managers risk misreading strong sales when weaker customer finances are already changing purchasing behavior underneath
October 12, 2026
Author: Matt Lathbury
Reading time: 8 min
SHARE




• The K-shaped economy, a term that emerged in 2020, describes a recovery where some groups advance while others fall behind
• In 2026, the K is becoming less visible in spending, even as wealth, resilience, financing, work, and AI advantages diverge
• In the United States, strong spending hides a divide between asset-rich households and consumers relying more on essentials, savings, or credit
• Europe’s K is more fragmented, driven by differences in housing costs, energy exposure, productivity, wages, and national economic conditions
• AI creates a new divide by rewarding people and companies with better skills, data, infrastructure, and access to reliable information
• For companies, the key lesson is to measure what funds demand, because equal revenue today can hide very different future purchasing power
Two shoppers leave the same store with equally full bags. One pays from rising salary income and a portfolio that gained value. The other pays more for necessities, postpones another purchase, and carries part of the bill on credit. The receipt records similar spending. Their economic positions are moving in opposite directions.
That is the central problem with the K-shaped economy in 2026.
Spending can look surprisingly resilient while the foundations beneath it separate. Inflation creates transactions. Necessities create transactions. Wealth gains create transactions. Borrowing creates transactions. A sales line can therefore remain healthy while the durability of the demand behind it deteriorates.
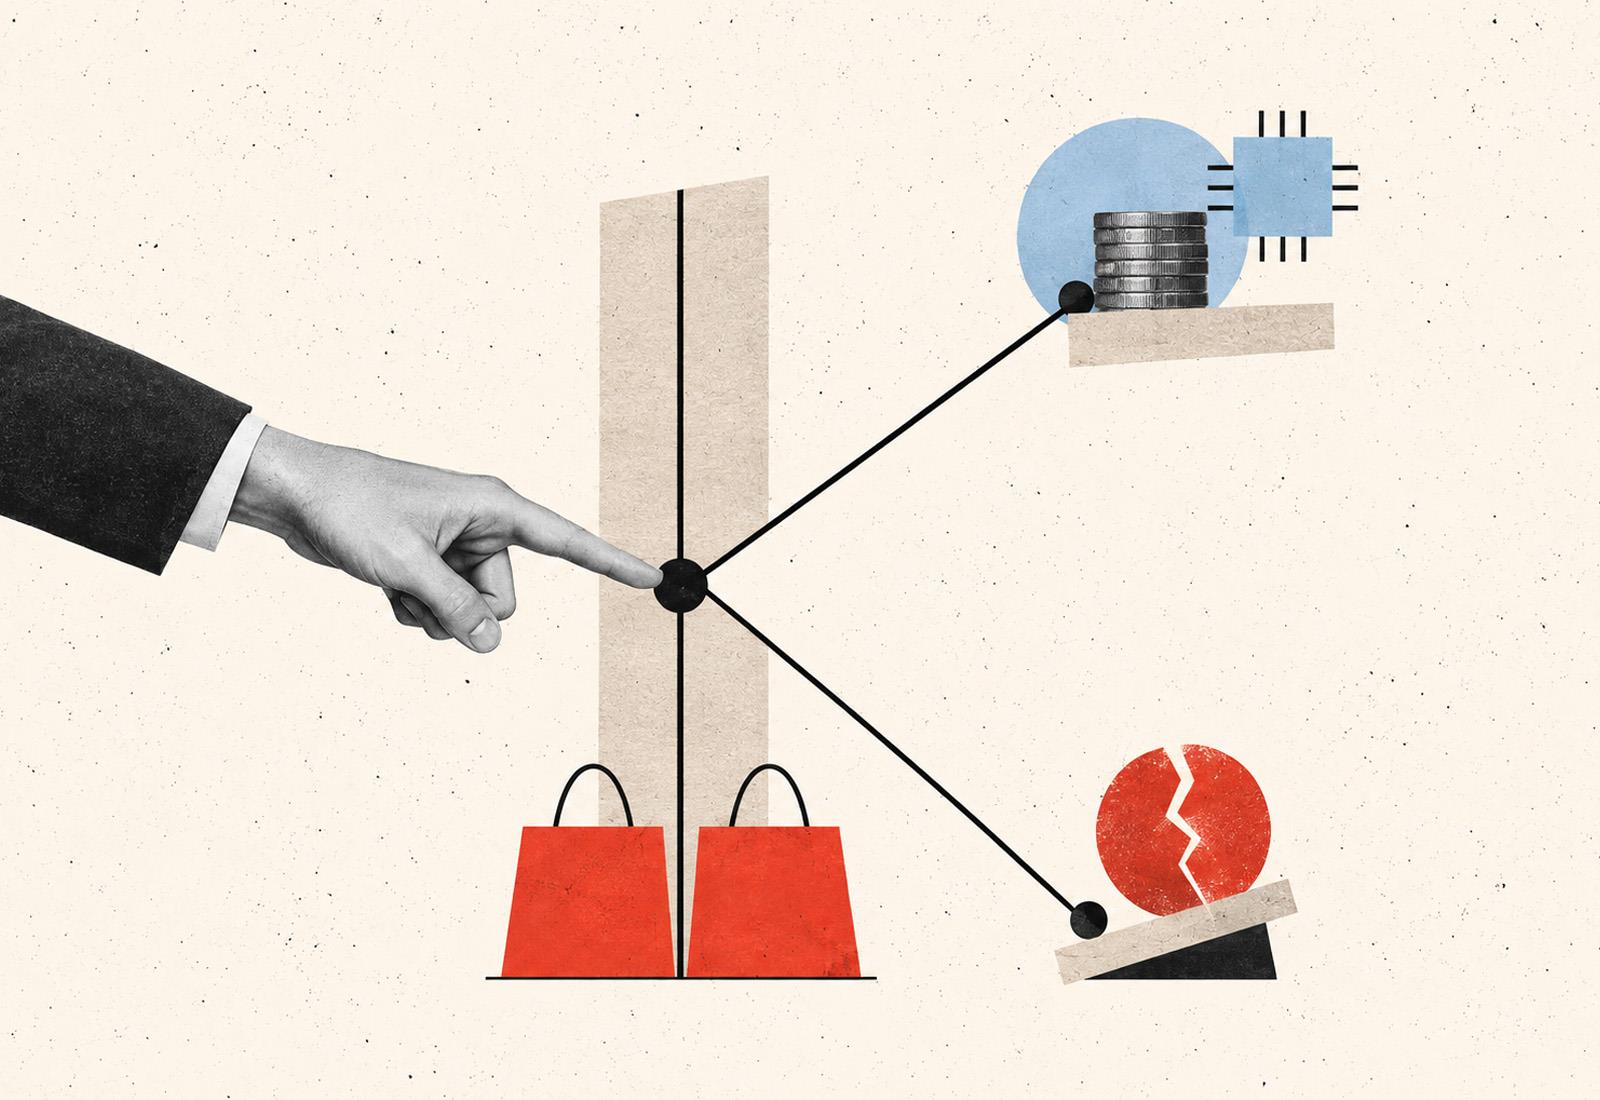
A K-shaped recovery originally described groups moving in different directions after the same shock. The upper arm captured households, workers, sectors, and businesses whose income, wealth, or prospects improved. The lower arm captured those whose position stagnated or weakened. The letter was useful because one national average could conceal two incompatible recoveries.
From Recovery To Structure
The term “K-shaped recovery” appeared during the COVID-19 crisis in 2020. Its earliest known use is credited to the anonymous Twitter account IvanTheK, which used it in April 2020. Economist Peter Atwater, a lecturer at William & Mary, saw the phrase and began promoting it widely. He became the person most responsible for popularizing the idea.
At first, the K described the pandemic recovery: technology companies, wealthy households and asset owners moved upward, while many workers and small businesses moved downward. Media, economists, business leaders and politicians then adopted the simple visual metaphor.
Over time, its meaning expanded. Today, a K-shaped economy describes an economy where different income groups, consumers, industries or companies move in increasingly different directions.
The metaphor then changed jobs. Between 2021 and 2024, it became less about the speed of recovery and more about accumulated advantage. Housing access, asset appreciation, job flexibility, and cheap financing strengthened some balance sheets. Rent pressure, depleted savings, expensive credit, and unstable work weakened others. A temporary recovery shape became a durable economic condition.
By 2026, the visible split can be harder to see. Lower-income households still spend when food, energy, insurance, transport, and rent become more expensive. Affluent households can spend because financial assets rise. Two consumers may produce the same revenue for a company while one is becoming more resilient and the other less so.
The more important change is geographic. There is no single global K. The forces separating winners from losers differ sharply across markets. In the United States, financial assets matter unusually much. In Canada and Australia, housing carries greater weight. In Latin America, informality matters. In China, the fault line runs through production and consumption.
America's K Hides In Spending
The United States shows how strong spending can coexist with weaker household flexibility. Census Bureau data released on September 16 showed August retail and food-service sales rising 1.2 percent from July and 6.0 percent from a year earlier. Those figures are nominal, so part of that strength reflects higher prices rather than higher real consumption.
That distinction matters because August consumer prices were 3.4 percent above a year earlier, according to the Bureau of Labor Statistics. Energy prices were up 16.3 percent, including a 27.4 percent increase in gasoline. A household can spend more at the checkout while buying little more, or even less, in real terms.
At the upper end, the Federal Reserve reported that household and nonprofit net worth rose by $12.8 trillion in the second quarter, reaching $195.9 trillion. Strong capital gains on corporate equities drove most of the increase. Asset appreciation therefore supports spending for households that own enough financial wealth to benefit materially from rising markets.
This creates two distinct spending engines inside the same economy. One is funded by wages, accumulated assets, and capital gains. The other is increasingly shaped by essentials, thinner savings buffers, and consumer credit. Both create revenue today, but they respond very differently to a market correction, an energy shock, or tighter lending standards.
AI adds another American split. The investment boom in chips, data centers, software, and power infrastructure lifts selected companies, workers, regions, and portfolios. Households outside those networks experience AI more through changes in work, prices, and services. Technology can therefore widen the K before its productivity gains spread broadly through wages.
Europe's K Has Borders
The European Union produces a different pattern because welfare systems, public healthcare, employment protection, and lower direct equity ownership soften some American-style extremes. Yet the single market contains large differences in housing tenure, energy exposure, fiscal capacity, industrial structure, wages, and productivity. Europe's K is fragmented geographically as well as financially.
Eurostat reported that retail trade volumes fell 0.6 percent in the euro area and 0.4 percent across the EU in July. The national spread was much larger. Germany fell 3.4 percent from June, while Latvia rose 2.5 percent and Cyprus 2.0 percent. A continental average masks very different consumer conditions.
Energy sharpens those differences. The European Central Bank projected euro-area inflation averaging 3.0 percent in 2026 and growth of 0.9 percent. For a well-insulated homeowner with modest debt, another energy shock is manageable. For a renter in inefficient housing with little savings, the same increase in heating or transport costs can displace discretionary spending immediately.
Housing produces another divide. Two households earning the same salary can have radically different consumption capacity if one owns a home with low financing costs and the other rents in an expensive city. National income bands therefore miss an increasingly important determinant of demand: how much of each euro is already committed before the consumer enters a store.
The European K also runs through productivity. Regions tied to advanced manufacturing, pharmaceuticals, financial services, digital infrastructure, or export clusters can remain strong while weaker industrial areas stagnate. A company selling across Europe may face prosperous customers in one city and financially defensive customers a few hundred kilometers away under the same regulatory framework.
Outside The European Union
The United Kingdom shows another version. The Bank of England expects household spending to remain subdued as higher energy prices, softer real-income growth, and mortgage costs constrain consumption. Its July report projected only 0.1 percent consumption growth in the third quarter, even though spending had remained more resilient than the income squeeze might suggest.
The mechanism is revealing. British households can smooth a temporary shock by saving less, drawing down deposits, or borrowing more. That keeps consumption alive for a time, but changes its quality. A retailer may see stable demand while the household behind the purchase has quietly reduced the financial buffer available for the next shock.
Switzerland looks different again. Swiss GDP grew 1.5 percent in the second quarter, the strongest quarterly increase since 2021, with chemicals and pharmaceuticals making a large contribution. Yet August consumer sentiment stood at minus 33, and households were less positive than a year earlier about their financial outlook and the timing of major purchases.
The Swiss split is therefore partly between globally competitive corporate sectors and cautious domestic households. The Western Balkans and Türkiye add still other versions, shaped more heavily by inflation, labor shortages, fiscal constraints, and uneven access to finance. "Europe" is too large an economic unit for understanding the customer behind a purchase.
Canada's Divide Runs Through Housing
Canada resembles the United States in wealth concentration, but housing and leverage play a larger role in household resilience. Statistics Canada reported household net worth of C$19.1 trillion in the second quarter. The highest wealth quintile held 69 percent of financial assets and almost half of non-financial assets, making asset gains highly uneven.
Debt changes the lower arm. Canadian households held about C$1.76 in credit-market debt for every dollar of disposable income in the second quarter, while residential mortgages represented almost three quarters of household debt. The aggregate ratio improved during the quarter, yet it still leaves many households highly sensitive to income, refinancing, and housing costs.
That produces several Canadian consumers inside one national market. A long-time homeowner with substantial equity may absorb a temporary shock comfortably. A recent buyer with a large mortgage may respond to the same shock by cutting discretionary purchases. A renter in an expensive urban market can face a third financial reality, even at a similar income.
Australia's K Also Owns Property
Australia has a related housing divide. The Reserve Bank reported in August that scheduled mortgage payments had risen close to their 2024 peak as a share of household disposable income after three rate increases earlier in 2026. Established housing prices had also softened after a long period of strong appreciation.
The impact depends heavily on when a household entered the property market and how much debt it carries. Long-time owners may still hold large unrealized gains. Recent borrowers face higher debt service and weaker affordability. Renters experience housing through another channel altogether, especially where supply remains tight and rents consume a high share of income.
At the same time, Australia is gaining investment from data-center expansion and AI infrastructure. That creates a second upper arm involving construction, energy, technology, and capital spending. The result is a property K layered with an emerging technology-investment K, while monetary policy continues to restrain household demand.
Latin America's Divide Is Formality
Latin America requires a different lens. ECLAC expects the region to grow only 2.2 percent in 2026 and identifies low investment, weaker formal job creation, and persistent labor informality as structural constraints. The crucial divide often runs between people and firms inside productive, formal systems and those operating outside them.
Formal workers and companies are more likely to have stable wages, credit access, social protection, technology, and links to higher-productivity supply chains. Informal workers can participate in the same consumer economy with far less predictability. A supermarket transaction may look identical even when one customer has a salary contract and another depends on volatile daily income.
Commodity exposure creates another layer. Chile and Peru can benefit when metals demand strengthens, while higher imported energy costs pressure households and firms. Central American economies are more exposed to remittances and U.S. demand. Caribbean countries face yet another mix of tourism, energy imports, debt, and, in Guyana's case, extraordinary oil-led growth.
For companies, a Latin American national average can therefore be especially misleading. The useful distinction may be formal versus informal income, remittance recipient versus locally funded household, commodity-linked region versus domestic-service region, or capital city versus secondary market. Income level alone says too little about the stability behind purchasing power.
Africa Contains Many Different Ks
Treating Africa as one consumer economy is even more misleading. The World Bank expects Sub-Saharan Africa to grow about 4.1 percent in 2026, while warning that higher fuel, food, and fertilizer prices disproportionately hurt vulnerable households. That continental figure contains radically different labor markets, fiscal positions, infrastructure systems, and commodity exposures.
South Africa illustrates a labor-market K. Its official unemployment rate reached 33.6 percent in the second quarter, with 8.5 million people unemployed. Kenya presents a different structure: the World Bank says formal jobs account for only about 15 percent of employment. Both countries have modern corporate sectors alongside much less secure household income.
Egypt offers another contrast. Macroeconomic conditions have stabilized and inflation has fallen sharply from its 2023 peak, yet World Bank estimates suggest poverty measured at the lower-middle-income international line increased by roughly five percentage points between 2022 and 2024. Better macro indicators do not automatically translate into stronger household balance sheets.
Commodity producers create still another African K. Higher oil or minerals prices can improve export earnings, tax revenues, corporate profits, and selected urban incomes while simultaneously raising domestic living costs. Countries with stronger electricity, logistics, finance, and digital infrastructure can convert growth into productivity faster than economies where those foundations remain scarce.
AI may widen these gaps over time. The IMF argues that Sub-Saharan Africa has fewer jobs immediately exposed to AI than advanced economies, which limits near-term displacement but also reduces the potential productivity dividend. Access to electricity, data, skills, capital, and digital infrastructure increasingly determines which firms and workers can join the upper arm.
Japan Splits Companies And Households
Japan's divergence sits between corporate strength and household purchasing power. Government statistics show that real consumption expenditure for two-or-more-person households fell 3.6 percent year on year in July, while real income for workers' households fell 3.8 percent. Those numbers sit beside continuing investment and demand connected to AI and advanced manufacturing.
The Bank of Japan expects the economy to keep growing moderately, supported partly by AI-related demand and government measures, while higher oil prices weigh on activity. It also expects inflation to move clearly above 2 percent later in fiscal 2026 because of energy, semiconductor costs, and the weaker yen.
That combination creates a specific Japanese K. Exporters, automation specialists, semiconductor-linked companies, and firms able to raise productivity can occupy the upper arm. Households facing higher import and consumer prices can feel much less prosperous. Corporate earnings and national output can therefore improve without creating equivalent confidence at the kitchen table.
China Separates Supply From Demand
China may offer the clearest production-consumption split. National Bureau of Statistics data show retail sales rising only 1.1 percent year on year during the first eight months of 2026. Online goods and services sales grew faster, while department stores, branded specialty stores, autos, furniture, and building materials showed much weaker performance.
The production side tells a different story. Advanced manufacturing, telecommunications equipment, digital infrastructure, exports, and AI-related investment can expand rapidly even while property weakness restrains confidence and household spending. China's upper arm therefore includes sectors and regions connected to strategic technology and exports, rather than simply households with the highest incomes.
For global businesses, the distinction is critical. Strong industrial output does not guarantee strong discretionary consumption. A company can see vigorous demand from Chinese factories, data centers, and technology supply chains while facing cautious consumers in categories linked to housing, big-ticket purchases, or confidence-sensitive spending. One GDP number cannot reconcile those markets.
Asia's Technology K Is Accelerating
Taiwan demonstrates how powerful the upper arm can become when a country sits directly inside the AI investment cycle. Its statistics agency projects real GDP growth of 11.05 percent in 2026, with real exports up more than 21 percent and private fixed investment up 11.58 percent as semiconductor and AI-hardware capacity expands.
The transmission reaches households as well. Taiwan's government expects private consumption to grow 4.76 percent, supported by corporate earnings, a strong labor market, and stock-market wealth. That is an unusually direct path from global AI capital expenditure to domestic income and spending, although it also creates exposure to any eventual cooling in technology investment.
Malaysia, Vietnam, the Philippines, Thailand, and South Korea participate in the electronics cycle to different degrees. The World Bank has identified AI-related electronics exports as a bright spot across several East Asian economies while broader private investment remains below pre-pandemic levels and consumer confidence remains subdued. Sector success does not automatically become economy-wide confidence.
South Asia follows another path. The World Bank estimates that only about 10 percent of the region's workforce is formally employed. India can combine fast national growth, digital adoption, and globally competitive services with a huge informal economy, uneven skills, and sharp regional differences. The resulting pattern looks more multi-speed than neatly K-shaped.
Indonesia is different again. The World Bank expects growth of about 5.0 percent in 2026, supported by domestic demand. Its important split is less about financial assets than productivity: formal, scalable, digitally connected firms and workers can improve faster than lower-productivity businesses and employees with weaker access to skills, finance, infrastructure, and technology.
AI Adds A Second K
AI now cuts across nearly every regional pattern. The IMF estimates that around 60 percent of jobs in advanced economies are exposed to AI, with some workers positioned to gain productivity and income while others face weaker demand for their tasks. Exposure is lower in poorer economies, but so is the immediate productivity opportunity.
Europe illustrates the scale of the opportunity and the constraint. IMF research estimates that AI adoption could lift European productivity by roughly 1 percent cumulatively over five years, with wide differences by country. The gains depend on adoption, skills, regulation, data access, energy, and whether firms redesign work instead of simply adding software.
The consumer side is changing at the same time. AI can compare specifications, warranties, prices, reviews, and alternatives in seconds. That lowers search costs for shoppers who know how to use it and raises the commercial value of structured, verifiable product information. Poor data can now remove a brand from consideration before advertising has any chance to work.
This creates an information K alongside the income K. Some consumers gain a capable purchasing assistant that can screen hundreds of options quickly. Others lack access, confidence, or the ability to judge weak answers. Companies therefore face a market where purchasing power increasingly includes financial capacity, digital skill, and the quality of information available to machines.
The Average Customer Is Failing
For management teams, the practical problem begins with averages. The "average customer" in a spreadsheet can combine an asset owner's wealth, a renter's housing burden, a pensioner's energy exposure, and a young professional's AI-enabled productivity. Nobody actually lives that financial life. Products designed around the composite can miss every real customer segment.
Income segmentation is only slightly better. Two households with the same annual income can have different liquid savings, debt payments, housing tenure, dependants, job security, energy costs, and family support. Their purchases may look identical in September while their ability to repeat those purchases in January differs substantially.
Companies should therefore measure demand quality as well as demand quantity. Repeat intervals, unit volumes, promotion dependence, downtrading, payment stress, financing uptake, returns, warranty claims, service contacts, and subscription cancellations reveal more than revenue alone. They help distinguish preference-driven demand from necessity, temporary financing, or the liquidation of household financial buffers.
A useful management question is simple: what funded the purchase? Wage income behaves differently from capital gains. A mortgage-free homeowner behaves differently from a recent borrower. A remittance-funded household behaves differently from a formally employed one. A purchase made because energy costs rose behaves differently from a purchase created by genuine discretionary confidence.
Design For Unequal Resilience
Product architecture should reflect those differences without degrading the core offer. Lower-cost versions work best when they remove expense rather than quality signals customers care about. Smaller packs, refill formats, repair, trade-ins, pause options, dependable warranties, and transparent lifetime costs can protect affordability without teaching customers to wait permanently for discounts.
Premium customers also deserve closer analysis. Wealth effects can support higher spending, but affluent buyers are becoming easier to compare across brands because AI reduces information costs. Premium pricing survives when durability, service, safety, performance, convenience, or status is documented clearly. Unsupported superiority becomes easier for both consumers and machines to challenge.
Portfolio planning should separate volume, margin, and repeatability. A promotion can produce excellent revenue while borrowing purchases from the next quarter. Financing can preserve conversion while weakening future flexibility. A slower-selling product with strong replacement, service, or subscription economics may contribute more durable value than a high-volume offer dependent on financial stress.
Geography needs the same discipline. A European strategy should distinguish national energy exposure, housing structure, and city-level purchasing power. An African strategy should account for formal employment, infrastructure, and commodity exposure. In Asia, companies should know whether demand comes from domestic consumption, exports, remittances, tourism, property, or the AI capital-expenditure cycle.
Compete Before The Checkout
AI also moves competition earlier in the purchase journey. Product information needs to be complete, current, structured, and consistent across brand sites, retailers, service pages, and markets. Warranty terms, specifications, availability, evidence, and claims increasingly become inputs into automated comparison. Contradictions that once created mild confusion can now eliminate a product from a shortlist.
That makes AI shortlist visibility a measurable commercial metric. Companies can test whether leading systems include their brands for specific needs, budgets, and use cases, then examine the sources and reasons behind inclusion or exclusion. The exercise should be repeated by country and language because the underlying evidence available to AI differs across markets.
Trust becomes operational rather than rhetorical in this environment. Verified reviews, independent research, clear complaint handling, credible certifications, precise claims, and consistent product data reduce uncertainty for both human customers and automated intermediaries. A brand promise that exists only in campaign language has little value when the buyer asks a system to verify it.
Human service becomes more valuable at the difficult edge of the journey. Routine comparison can be automated cheaply. Complex complaints, financial consequences, safety questions, and emotionally important purchases still reward accountable judgment. The opportunity is to place competent people where uncertainty is expensive, rather than spreading human contact indiscriminately across every interaction.
ICERTIAS Can Reduce Decision Friction
The K economy creates an awkward problem for brands. Some customers are scrutinizing every spending decision; others can still spend freely but have become harder to impress. The same company must increasingly persuade people with very different financial constraints without turning its brand into either a discount proposition or an expensive promise without proof.
This is where ICERTIAS recognition can become commercially useful.
QUDAL - Quality Medal Makes Quality Legible
Price is visible immediately. Quality usually is not. Consumers often discover reliability, service performance, or product satisfaction only after purchasing. QUDAL - Quality Medal converts an otherwise difficult-to-observe attribute into an externally researched signal of consumer-perceived quality. Importantly, ICERTIAS does not claim that QUDAL measures absolute technical quality; it identifies the brand consumers most frequently associate with highest quality through unaided research.
That distinction becomes valuable when customers are more reluctant to make expensive mistakes.
Best Buy Award Protects The Middle
The danger in a K economy is assuming that financially cautious customers simply want lower prices. Often they want less risk for the money they spend. Constant discounting can win a transaction while weakening margins and brand perception.
Best Buy Award offers another route. Its research asks consumers, without presenting brand choices, which provider offers the best price-quality relationship. For companies caught between premium competitors and aggressive discounters, Best Buy Award can support value without forcing the brand to compete on price alone.
Customers' Friend Humanizes Automation
AI creates a different scarcity: access to a person who understands the problem. Gartner found in 2026 that 87% of customers consider human-agent access essential when companies use generative AI in customer service.
That gives Customers' Friend a potentially sharper role. The certification evaluates customer experience and service quality rather than technological sophistication itself. In increasingly automated markets, it can help distinguish companies that use technology without allowing the customer relationship to become anonymous.
The K Is A Management Problem
The managerial problem is not simply that customers are becoming more unequal. It is that many corporate systems were built for a world in which broad economic indicators were reasonably useful guides to business conditions. Annual budgets, market forecasts, customer segments, pricing models, and country strategies often assume that people exposed to the same economy will respond in broadly comparable ways.
That assumption is becoming less reliable.
A K-shaped economy can create false signals inside otherwise competent companies. Sales may exceed plan while customer economics deteriorate. A premium category can grow even as its addressable customer base narrows. A market can appear attractive because national consumption is rising, although most incremental spending comes from a relatively small group. Marketing campaigns can generate acceptable conversion while acquisition costs quietly become uneconomic for weaker customer segments.
The result is a new management risk: companies can make rational decisions from data that accurately describes the past but poorly describes what happens next.
Managers therefore need to change the unit of analysis.
Instead of asking only which customers buy, they should identify which customer groups remain economically capable of buying under less favorable conditions. Management teams can stress-test important segments against higher financing costs, weaker asset prices, lower employment security, or another inflation shock and estimate how revenue, margin, and retention would respond.
Resource allocation should also become more conditional. Rather than committing budgets primarily through annual plans, companies can establish trigger points that shift marketing, inventory, pricing, credit exposure, and service capacity when customer behavior begins changing.
Finally, management should treat divergence as a strategic scenario rather than a temporary macroeconomic disturbance. The question is no longer simply whether the economy will grow.
The more useful question is: which parts of our customer base, product portfolio, and geographic footprint still work if the two arms of the K move further apart?
Companies that can answer that question early gain something increasingly valuable: the ability to adapt before aggregate numbers reveal the problem.
The Next Shock Will Reveal It
Managers preparing for 2027 should model several shocks together rather than one at a time. Energy prices can hit constrained households while supporting exporters. A market correction can reduce affluent consumption while leaving essential spending intact. Tighter credit can expose financed demand. Faster AI adoption can alter both employment and the discovery of products.
The leading indicators should sit closer to the household than GDP does. Real selling prices, unit volumes, promotion elasticity, failed payments, financing use, downtrading, repeat intervals, search behavior, service reasons, and AI shortlist visibility reveal stress earlier. They become more useful when compared with wages, energy prices, asset markets, unemployment expectations, and local credit conditions.
The K-shaped economy is therefore becoming harder to recognize from aggregate spending.
The United States has a financial-asset K.
Europe has geographic, housing, energy, and productivity Ks.
Canada and Australia lean heavily on property.
Latin America divides around formality.
Africa around jobs and infrastructure.
China around production and consumption.
Asia increasingly around technology.
What connects them is not a common cause but a common management problem.
Similar revenue can emerge from very different financial conditions, and those conditions determine whether customers can buy again.
The next shock will not invent the divergence.
It will show which apparently healthy demand was supported by resilient income and which was living on borrowed capacity.
The biggest strategic risk is mistaking strong sales for healthy demand; durable growth depends on repeatable purchases, trusted claims, and customer resilience